
t-SNE
T-distributed Stochastic Neighbor Embedding (t-SNE) is a technique for visualizing high dimensional data in fewer dimensions while preserving clusters. Probabilities are computed for each pair of high dimensional data points being part of the same group, and then points are placed randomly in the lower dimensional space and their positions are iteratively improved until the difference between the probabilities in low and high dimensional space is minimized. By analogy, t-SNE minimization simulates forces between all data points, attracting similar points and repelling dissimilar points. (A more detailed explanation of the method is available in my presentation) . This is an example of an n-body problem, something I’m familiar with from my ongoing n-body project.
In a 2021 paper, Mark van de Ruit et. al. propose a novel method for evaluating this instance of the n-body problem, and provide an implementation for GPU which outperformed the existing state-of-the-art in this domain. To better understand the details of this new method, As part of my seminar course in the fall of 2022, I implemented a simplified version which runs on the CPU and produces a 2-dimensional embedding.
Algorithms
My t-SNE visualization system begins by generating probability data using Sklearn, as the focus of the project is on the minimization step only. Currently only MNIST data has been tested, but any dataset is theoretically compatible.
I found it useful to implement several other t-SNE minimization algorithms, both as intermediate steps in development and as reference points in order to understand the performance characteristics of the final algorithm.
- I began by implementing a naive solution, which performed poorly but could be used to verify the correctness of more advanced minimizers.
- Next, I implemented a minimizer based on the Barnes-hut algorithm, which builds a tree over the embedding space and computes interactions between each point and the clusters summarized by the nodes of the tree.
- This was extended to work with a Linear-BVH in place of the typical Quadtree. This version uses a radix-sort along a space-filling curve to produce the tree in linear time complexity.
- Finally, I added a dual-traversal minimizer which obtained better performance by computing node-node interactions in place of point-node interactions.
- The dual-tree minimizer is an adaption of the dual-traversal minimizer, computing interactions between the nodes of a linear-BVH and nodes of a Quadtree.
Visualizations
While implementing these algorithms, it was also helpful to develop visualizations to show what was happening. All visualizations were implemented by hand using Cairomm, because performance was critical in order to watch the algorithms work in real time.
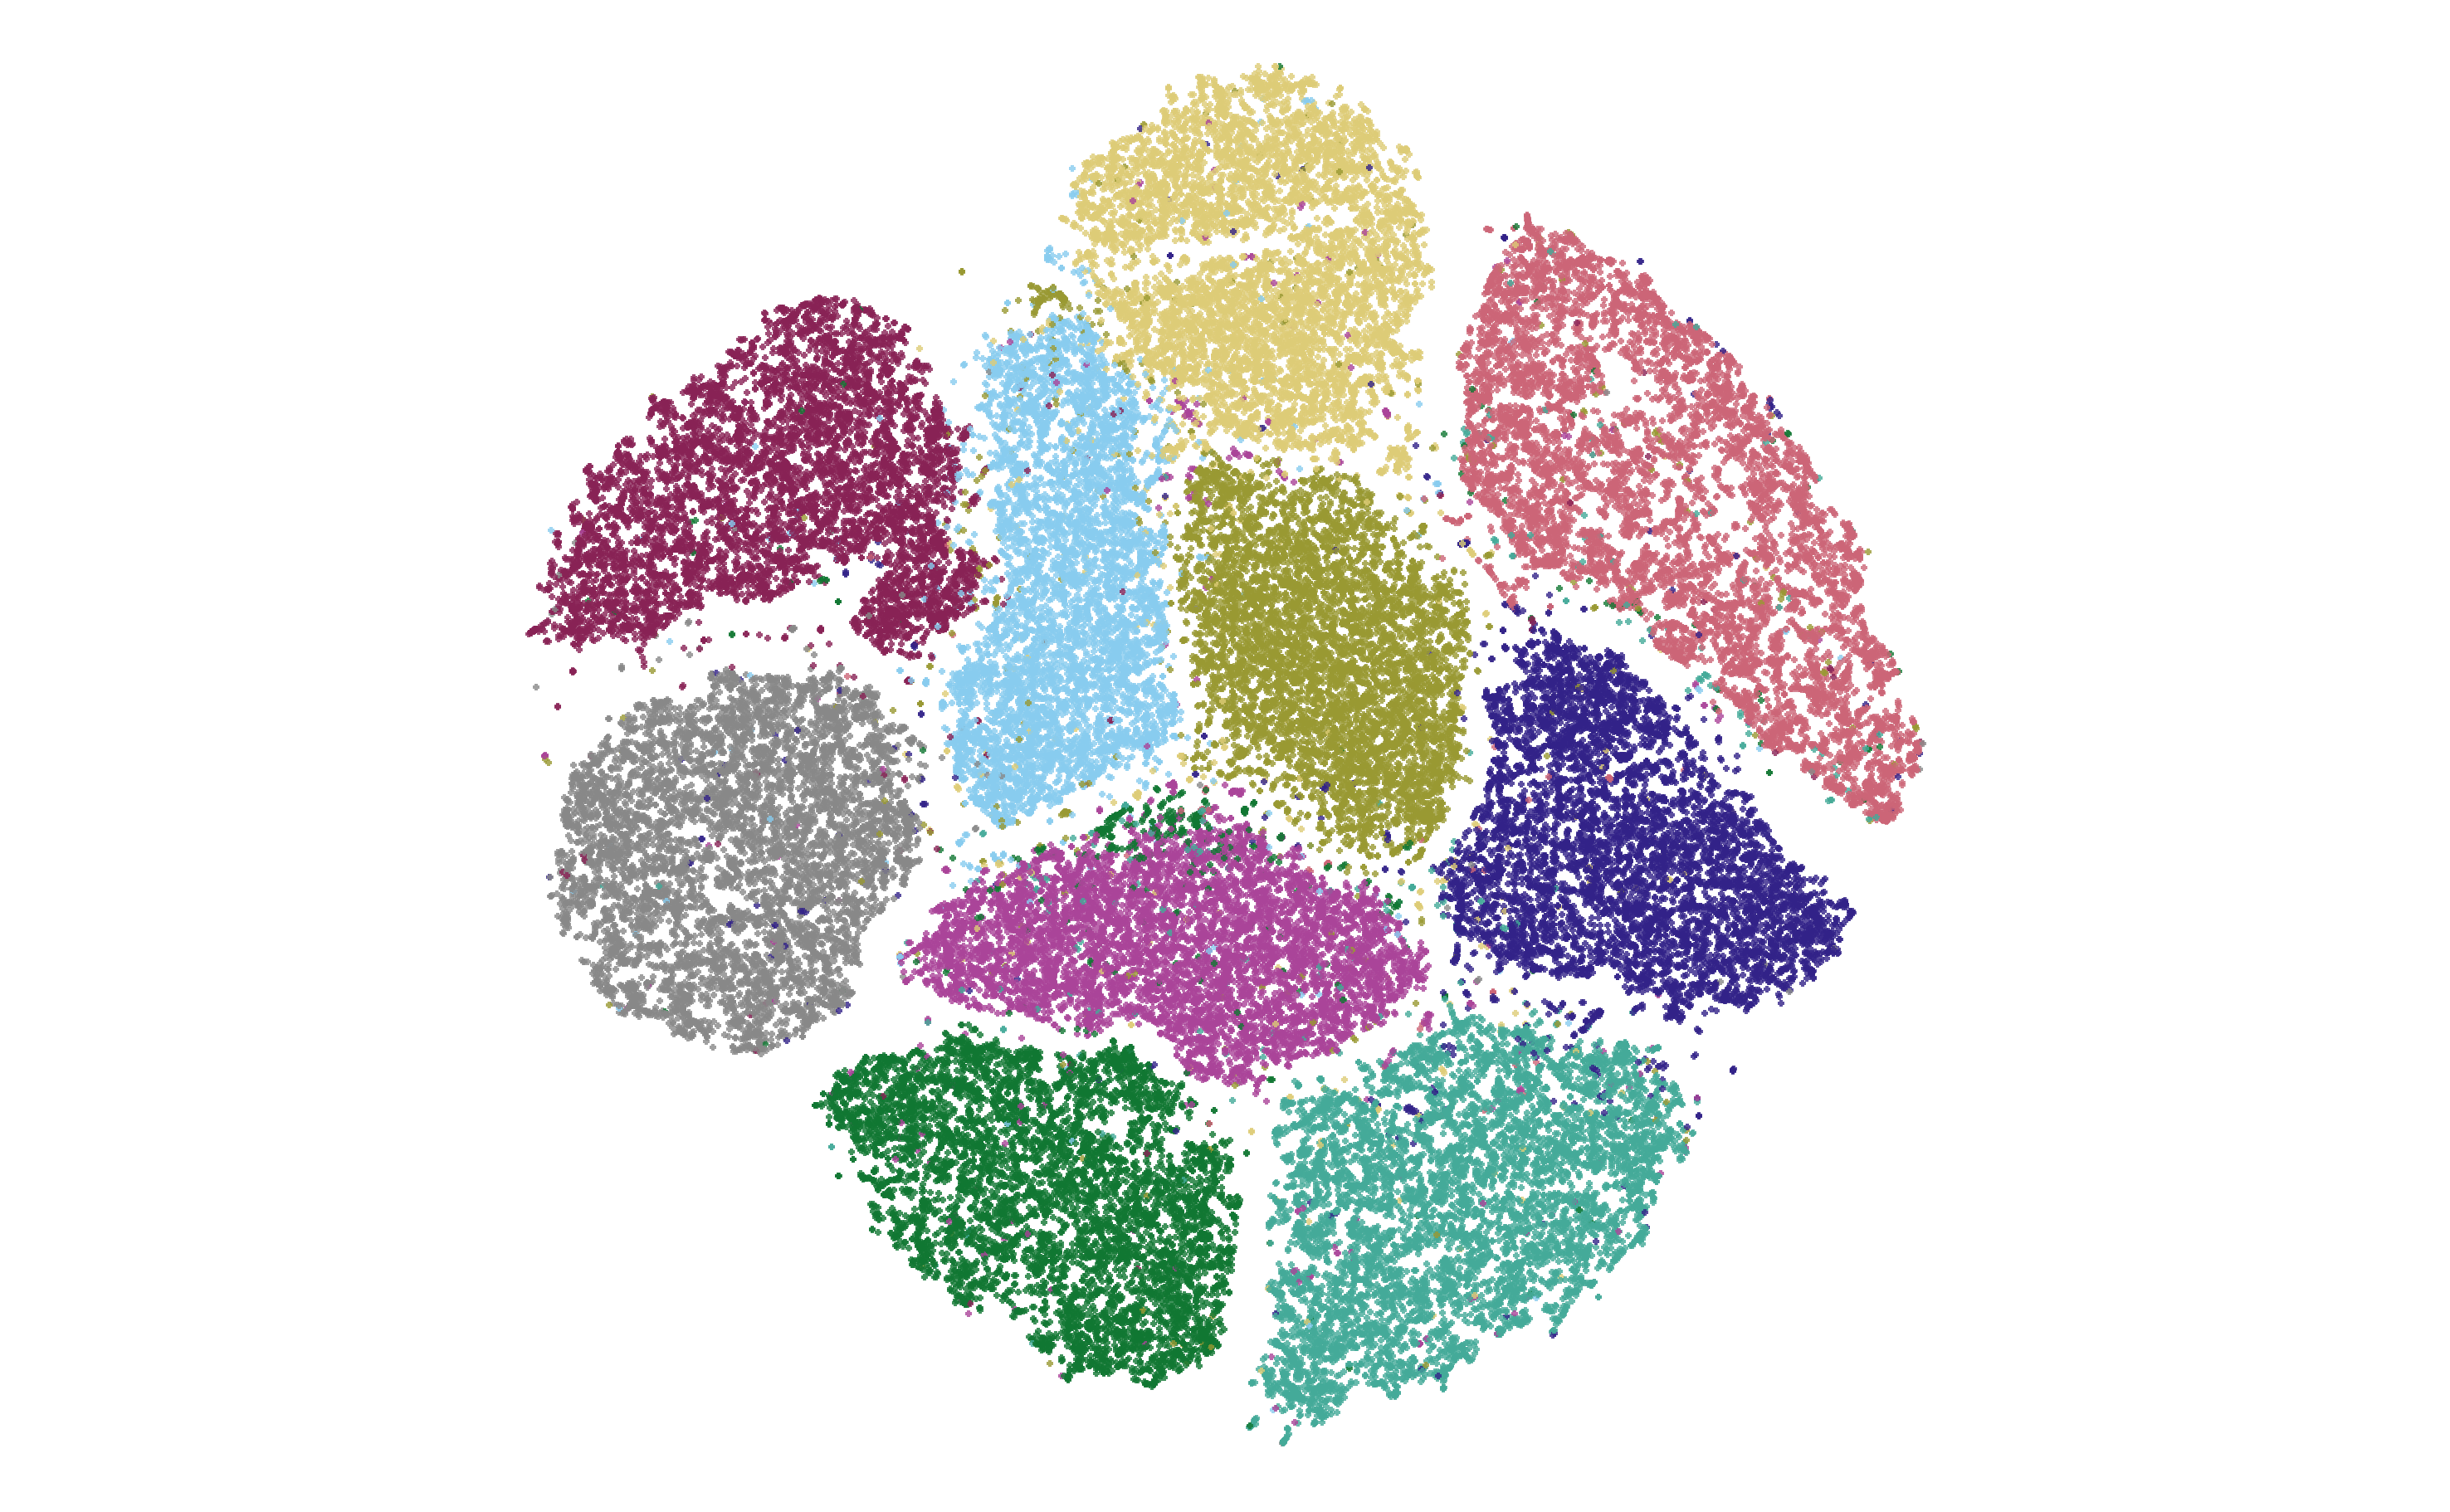
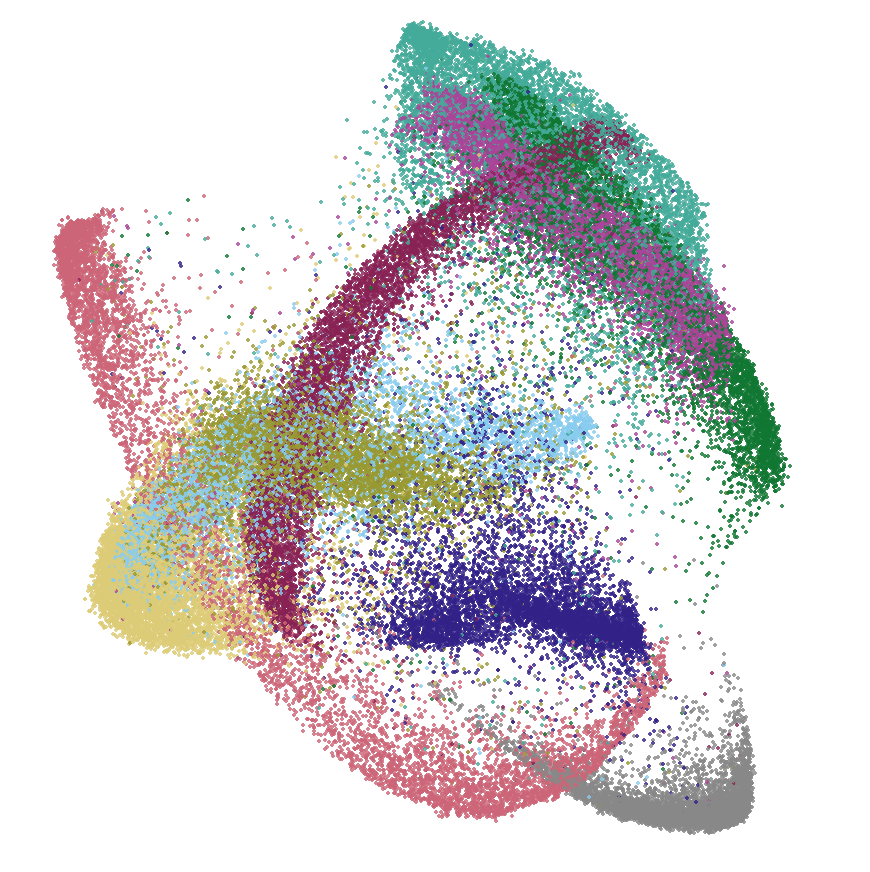
I began by creating a scatter plot of the embedding coordinates, color coded by their labels. The below image shows such a scatter plot from MNIST data during minimization.

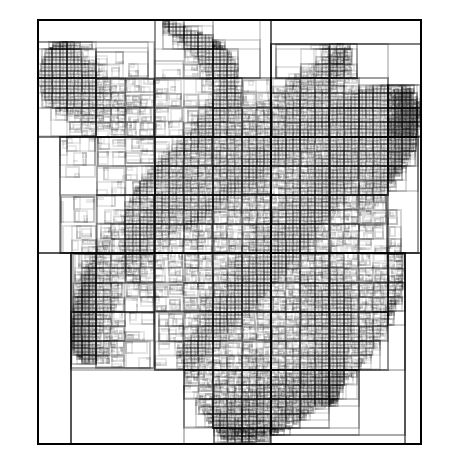
I created another plot type which could show the bounding volume hierarchies used for acceleration. This proved very useful for optimization.
While developing the Linear-BVH, I built an ordering plot to help me understand the space-filling curve which determines where points appear in the tree.
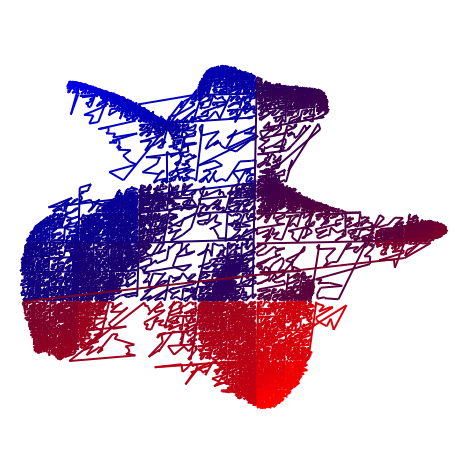
Ordering plot for a Linear BVH. The line connects points in the order they appear in the underlying list, with color transitioning from red to blue based on their index.
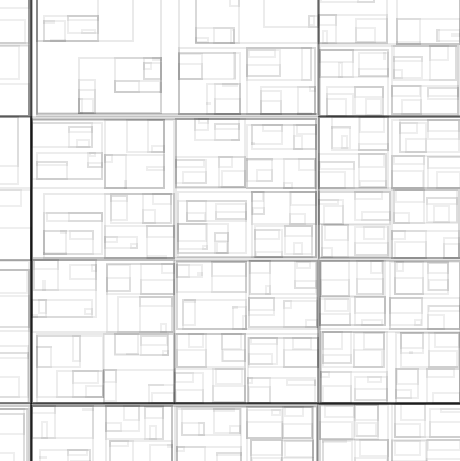
Finally, implementing the dual hierarchy algorithm required a “Field Tree” which collects forces on each of its nodes. I created a new field tree plot which displayed the force vectors on each node as colors.
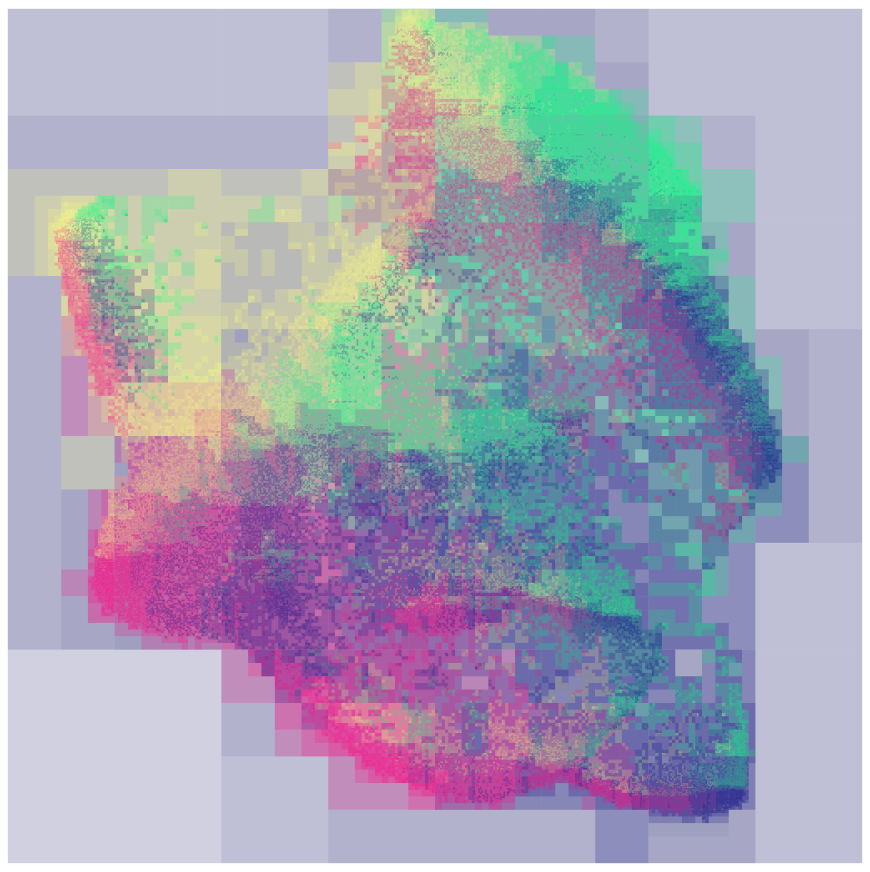
Field tree plot for a Field-Quadtree. Each tree node is rendered as a translucent rectangle, colored based on the force applied to that node.
UI
I bundled all of these visualizations together into a UI built with Gtkmm. This was useful for my final demo to the seminar class.
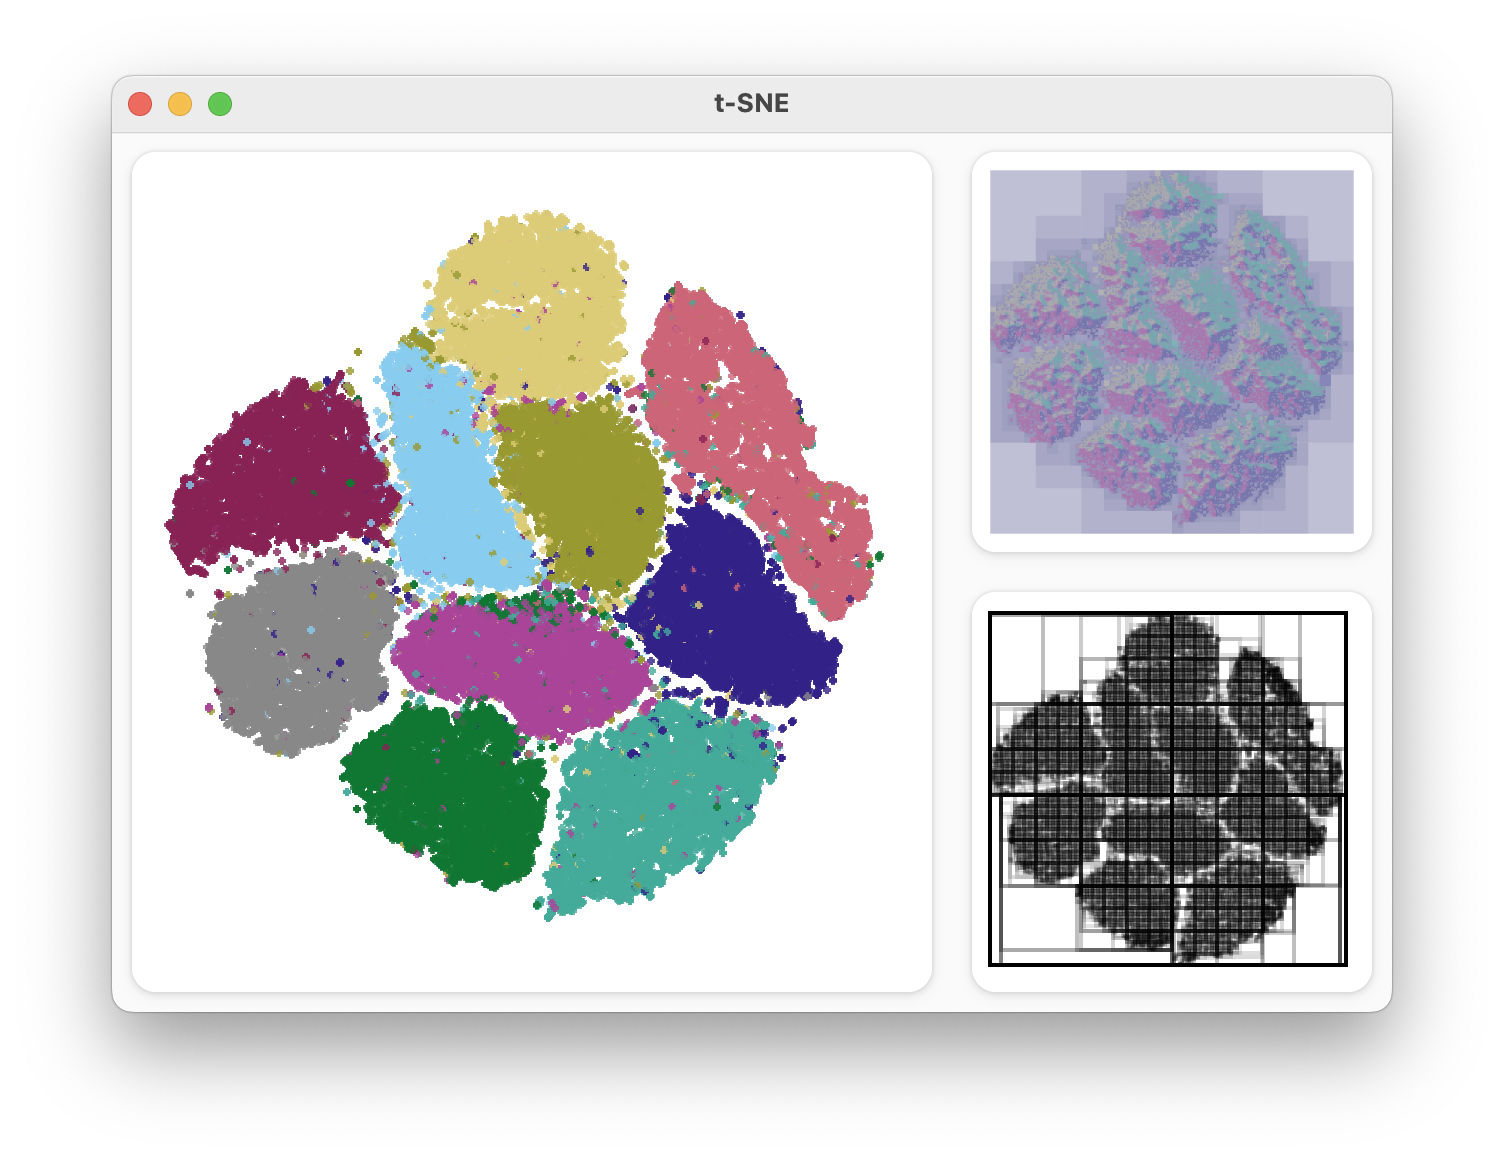
Application showing the embedding and debug view of a Dual Hierarchy minimization.